Assignment
CHECKLIST:
- The selected graph is the best option for representing this data
- All numbers double-checked
- Spell check
- Headline/title
- Correct units of measurement
- Description of what the x- and y-axis represent
- Y-axis starts at 0 (If not: Is it clearly shown? Does the editor agree?)
- Conscious choice of colours (explained on request)
- Source
- Instructions for use (if the graph is interactive)
- Context or explanation (if necessary)
- Byline
- Accessibility (contrast, caption for screen readers, attached table, etc.)
- (explained on request)
- Understandable for someone who sees the visualization for the first time
- (Show it to someone outside the newsroom)
- The visualization checked on a mobile device
DATAWRAPPER
1 A)

Write a short description of your choices:
I created a line graph where the X-axis represents time and Y-axis the number of reactors. I set the top value for the Y-axis at 500 to ensure that the entire graph is visible and allowed the X-axis to run from 1940 to 2025. I’m not sure, however, if it would’ve been wiser to let it start and end at the exact years the data covers.
I moved the legend from the “end” of the line graph to the top left of the chart since most people read top to bottom and left to right. This placement might make it quicker to interpret the graph.
My annotations are fairly lengthy but follow the “formula” presented during our lectures. While I couldn’t figure out how to name the axes, I think the title and legend give enough context for the reader to be able to “read” the visualization; the title indicates the visual covers a certain timespan and the legend states “number of reactors”.
The checklist reminded me to include a description of the charts’ interactive features – seeing the exact value when hovering/clicking. Finally, I included the name and a link to the data source.
The chart includes a text description for screen readers which was fairly challenging to write – I’m definitely not “fluent” in describing data.
In terms of design, I made a few colour choices. I chose a green line to evoke some associations with radiation. The colour might not be ideal for colourblind users, nor super high contrast for those with visual impairments, but since it’s a single-line chart it works well enough. I also used a high-contrast setting for the rest of the chart to improve visibility.
1 B)

Write a short description of your choices:
Focussing on the differences from the line chart:
I created a column chart showing the top five countries by total electrical capacity produced by nuclear reactors. I considered a bar chart but chose columns after shortening country names. Before doing so readability on mobile wasn’t sufficient.
I ensured the scale was appropriate by setting the Y-axis to start at 0 and end at 100,000, “accommodating” the tallest column. I sorted the countries from highest to lowest so the reader can more easily compare the countries.
I struggled with how precise to make the title, label, and description of the chart: how much can I shorten “total net nuclear reactor electrical capacity”? If I fully comprehend the topic it’d probably be easier to make these judgement calls.
The colour choices I made are similar to the line graph for visual consistency.
1 C)
- Have you followed the checklist for visualizations (every step)?
- Yes!
- Colours: How easy or difficult is changing colours using the tool (Datawrapper)?
- It was easy. The colour palette is limited but it could be manipulated via sliders, or by inputting a HEX code.
- Text/Labels: How easy or difficult is it to work with text and labels in the tool (Datawrapper)?
- Overall, it worked well – I was only disgruntled by the fact that I couldn’t name the axes. I suspect they didn’t consider placing a Y-axis label on top instead of on the side of the chart, and eliminated it altogether so that it doesn’t eat precious horizontal space on mobile devices. There are other text fields available on top/bottom/overlay.
- Flexibility: How flexible is the tool (Datawrapper)? Can you make the changes you need?
- For this task, Datawrapper was flexible enough. I might feel constrained if I were to produce something more complex or had a strong vision before starting.
- Accessibility: What are the different accessibility options provided by the tool (Datawrapper)?
- The high-contrast option is great, and the tool allows me to include a description for “screen readers”. The preview options (device/screen size, colourblind mode, dark mode) were also helpful.
- Smartphone: How do the charts appear on your smartphone? Have you faced any issues while accessing them?
- The charts load quickly and display accurately – they’ve succeeded in making the charts fully responsive. However, upon checking the mobile version, I realised that I had to go back and alter the chart interaction description to say hover and click.
FLOURISH
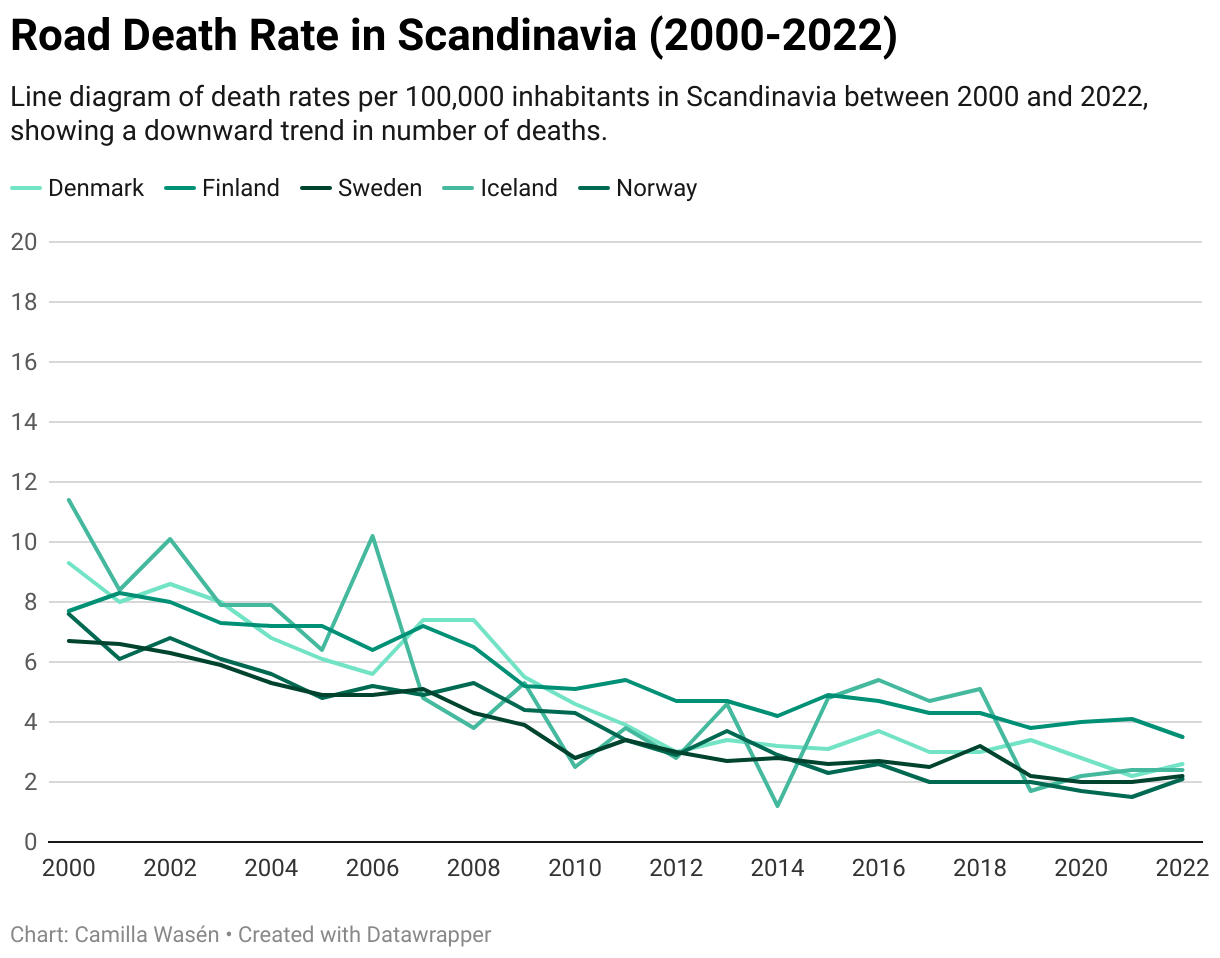
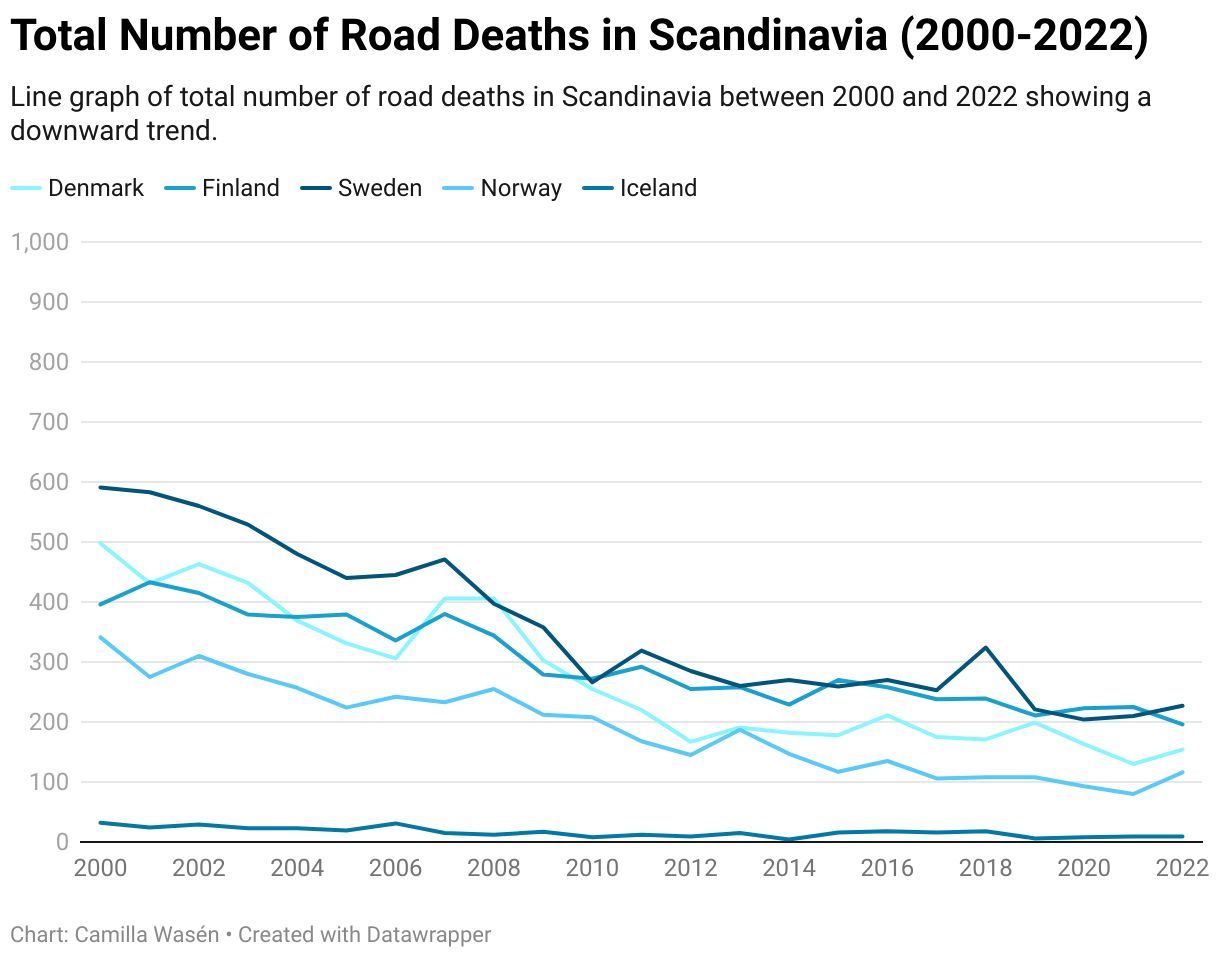
2. A)
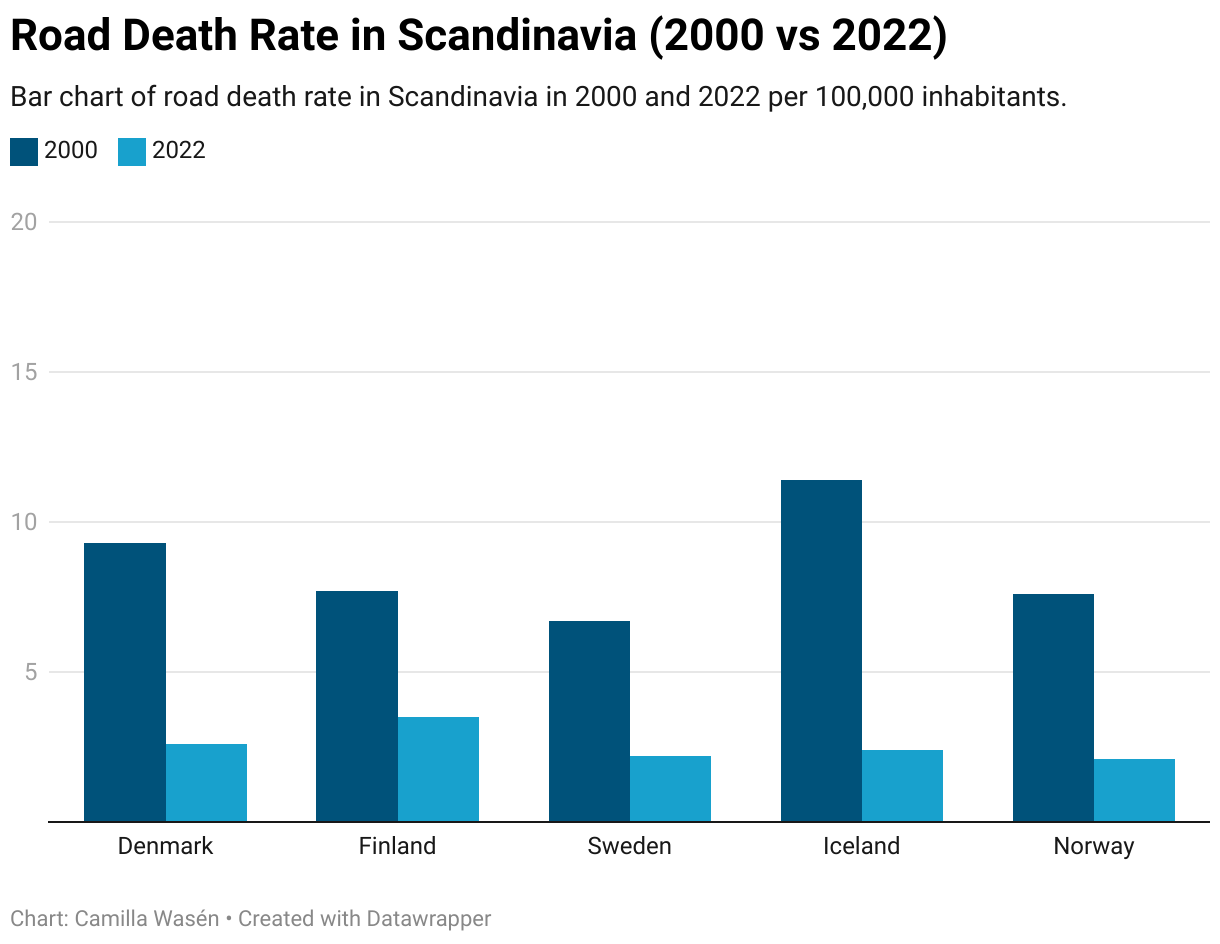
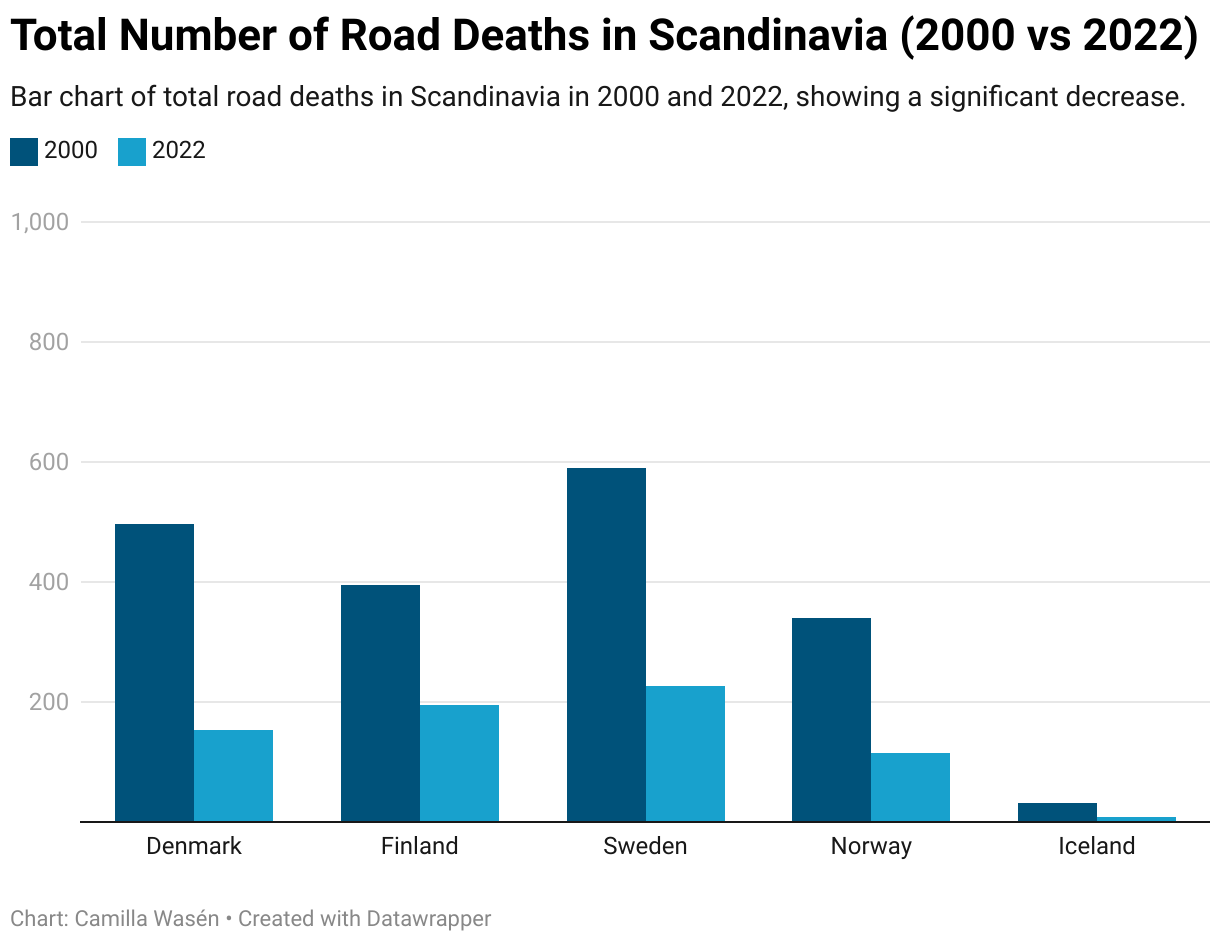
2. B)
2. C)
- Have you followed the checklist for visualizations (every step)?
- Yes!
- Colours: How easy or difficult is changing colours using the tool (Flourish)?
- Changing the colours was easy enough and most elements have customizable colours.
- Text/Labels: How easy or difficult is it to work with text and labels in the tool (Flourish)?
- With Flourish, you can change text placement, fonts, and more, but navigating the accordion-style menus is time-consuming. Adding e.g. menu tabs would improve the user experience.
- Flexibility: How flexible is the tool (Flourish)? Can you make the changes you need?
- Flourish offers more design freedom and interactivity than Datawrapper, but I didn’t explore them for this assignment. I don’t enjoy the templates with pre-existing data, however; it seems an unnecessary delay to getting started.
- Accessibility: What are the different accessibility options provided by the tool (Flourish)?
- Flourish allows you to set a text description but appears to lack the high-contrast settings and colourblind checks available in Datawrapper.
- Smartphone: How do the charts appear on your smartphone? Have you faced any issues while accessing them?
- Generally okay, but the column chart appears a tad squished – they might’ve set a limit for the total height of their elements (so the visualization displays in full without scrolling). If this is the case, more descriptive text makes the chart smaller.
3.
Answer the following questions based on your experience:
- In what context do you think Datawrapper is the best tool, and why? When would you not use it?
- Datawrapper is great for creating simple visualizations quickly. The UX is more intuitive than Flourish, with clear steps and tabs to guide you through the process. However, I might not use Datawrapper if I needed more advanced customization or visualizations with extensive interactive features.
- What are the main benefits of using Datawrapper?
- Datawrapper is more intuitive, offers a quicker process, and has better preview options (e.g. colourblind check) than Flourish. I didn’t have to input much to produce a finished chart.
- In what context do you think Flourish is the best tool, and why? When would you not use it?
- Flourish might be better suited for creating complex, interactive visualizations. Since it offers more customization it’s also preferable if you have to create a visual that meets certain brand requirements. I wouldn’t use it to produce basic charts quickly.
- What are the main benefits of using Flourish?
- Flourish seems to give the user more control than Datawrapper which might come in handy if I’m creating something complex or visually “specific”. There are several functions and settings I haven’t tried yet, so it’s difficult to assess the tool as a whole.
- Which of the tools do you personally prefer so far?
- I prefer Datawrapper for its simplicity and preview options. Time-consuming customizations are difficult to swing when operating under newsroom time pressure.
Exercises