
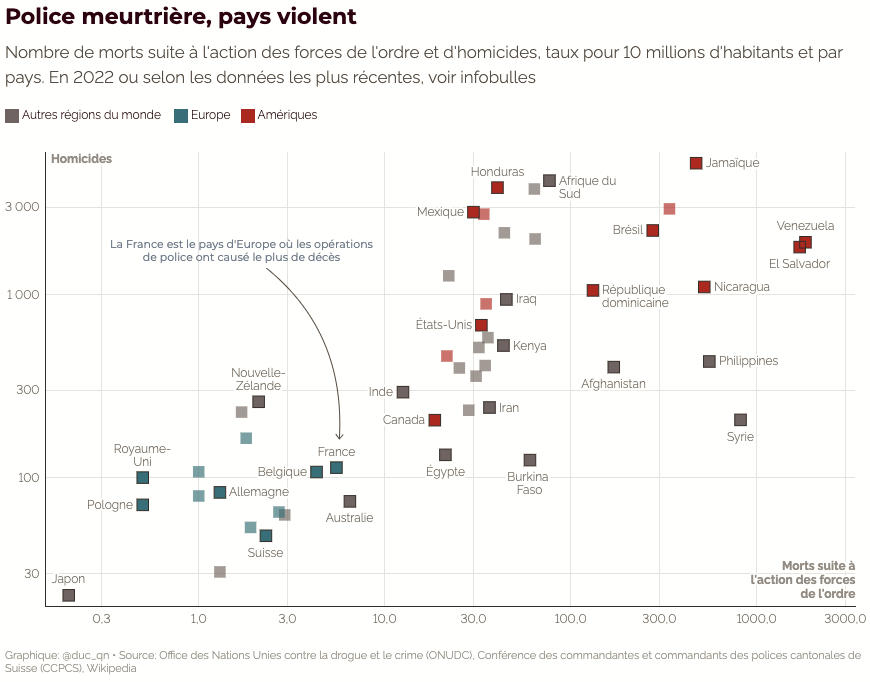
‘In graph: in which country does the police kill the most?’ is an article by the Suisse French-speaking journal Le Temps showcasing the correlation between the level of voluntary homicide in a country and the number of people killed by the police, establishing a direct link between a violent country and a violent police force. This article is a great example of data journalism for several reasons.
Source: https://www.letemps.ch/data/en-graphiques-dans-quels-pays-la-police-tue-t-elle-le-plus
Firstly, the scatter plot graph presented is interactive giving the reader the oportunity to see for themselves the different categories of the graph. This form of graph is used when several variables are included in the data. Making this type of graph interactive clarifies its meaning to the reader, as they become able to see one variable at a time, without being overwheled. However, the graph used in the article still has flaws which brings us to our second reason.
The writer takes the time to explain the limitations of the data, avoiding the spread of possible misinformation. The author takes the time to explain how limited the data collection is and that while the correlation between a violent country and a violent police force is undeniably present, the numbers do not represent that reality in detail as the policy on reporting homicides committed by the police force can greatly variate between different countries.
The type of data journalism used in this article can be defined as “needle in the haystack stories”. This method uses “datasets to find individual instances of behavior that may be suspicious or unethical”(Bradshaw, 2026) drawing the data from a particular story lead, in this instance, the death of Nahel a 17 years old french boy killed by the police after he refused to cooperate for a control. This is a great example of data journalism because it uses a story lead to map broader data and shine a light on the international issue of police brutality while explaining the data method in detail, informing the reader correctly.